April was a record-breaking month for electricity generation in Britain, with the National Grid reporting that carbon emissions from electricity generation fell to 19gCO2/kWh for a period on April 15th, surpassing the previous record. Electricity sourced from fossil fuels dropped to 2.4% over the same period.
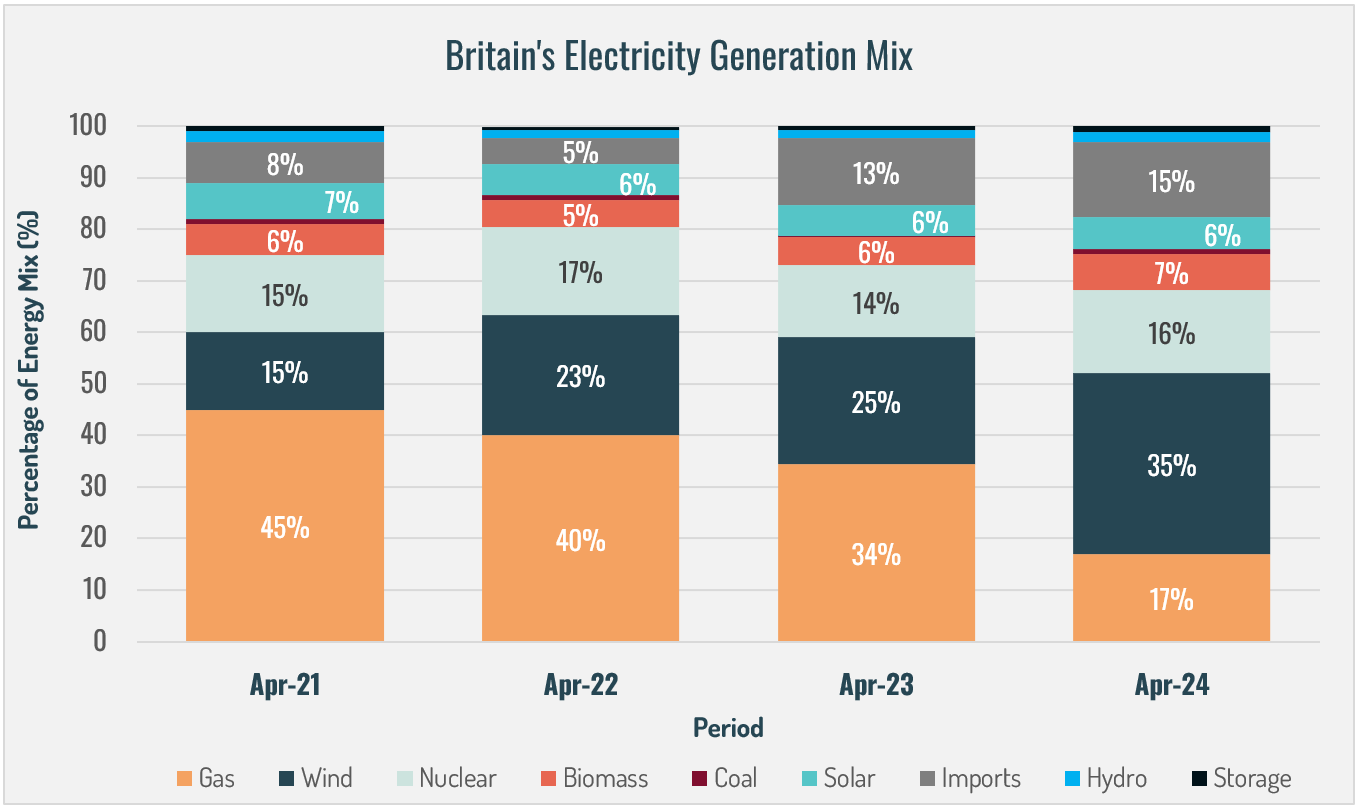
- Wind energy was the main contributing source to Britain’s electricity in April 2024, accounting for over a third (35%) of the mix, almost 10% more than in April 2023, and its highest contribution for April in the last four-years.
- Gas contributions fell dramatically compared to April 2023, representing only 17% of Britain’s electricity mix in April 2024, half of its April 2023 value. This is the lowest proportion of Britain’s monthly electricity it has made up since at least 2020.
- Solar contributions remained consistent with April for previous years, contributing 6% of the electricity mix in April 2024.
- Imports rose by 2%, comprising 15% of the mix, it’s highest proportion for April since at least 2020. Nuclear’s contribution rose by 2% from April 2023, to deliver 16% of Britain’s electricity mix in April 2024. Contributions from biomass, and coal increased by 1%, making up 7% and 1% of Britain’s electricity mix in April 2024, respectively. Both Hydro and Storage contributions remained consistent with April 2023.
- Almost 60% of the electricity generation in April 2024 came from zero-carbon sources, representing a 13% increase from April 2023, and the highest for April in the previous 4 years. The rolling 12-month average for May 2023 to April 2024 remains substantially lower than the previous three 12-month periods, at 143 gCO₂/kWh, and approximately a fifth lower (19%) than the previous 12-month period.
- Increasing the electricity generation delivered by renewable sources can help us achieve our Net-Zero ambitions, ensure energy security, and decrease reliance on imports.
Monthly Statistics
To view our interactive renewables map,
click here
Data source: National Grid ESO 2024 (https://www.nationalgrideso.com/electricity-explained/electricity-and-me/great-britains-monthly-electricity-stats)