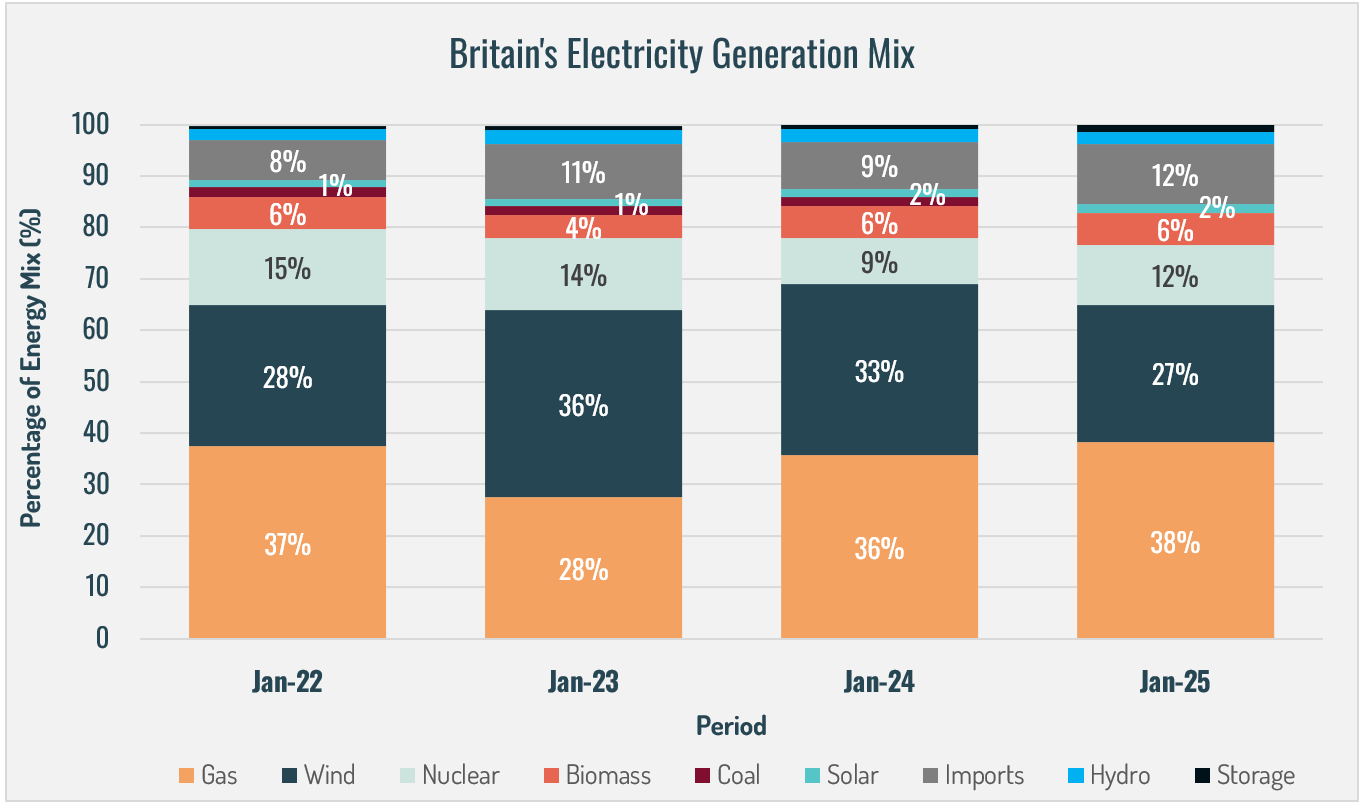
- In January 2025, gas accounted for 38% of Britain’s electricity mix, the highest contribution among all sources. This represented an 11% lead over wind energy and a 2% increase compared to January 2024. Wind energy, however, delivered its lowest January contribution in the past four years, comprising 27% of the energy mix.
- Nuclear and imports each saw a 3% increase, contributing 12% of Britain’s electricity generation. Contributions from solar, hydro, and biomass remained stable compared to January 2024, with solar and hydro each accounting for 2% and biomass 6%.
- Coal, which was phased out of UK electricity generation in September 2024, delivered 0% of electricity in January 2025. For comparison, coal contributed 2% in January 2024, equal to the individual shares of solar and hydro.
- Zero-carbon sources made up 43% of Britain’s electricity generation in January 2025 - the lowest proportion for January in the past four years. This was 4% lower than in January 2024 and 13% lower than January 2023. However, the rolling 12-month average for zero-carbon sources reached 51%, the highest of the past four years and 2% higher than the previous 12-month period.
- The carbon intensity of electricity generation in January 2025 was 168 gCO₂/kWh, the second highest of the past four years. Despite this, the rolling 12-month average carbon intensity fell to 125 gCO₂/kWh - a 19% reduction compared to the prior year and the lowest of the past four years, underscoring progress in decarbonisation.
- Increasing renewable electricity generation remains crucial to achieving net-zero goals, enhancing energy security, and reducing reliance on imports.
Monthly Statistics
To explore more insights, visit our interactive renewables map
here or on our website.
Data source: National Grid ESO 2025 (https://www.nationalgrideso.com/electricity-explained/electricity-and-me/great-britains-monthly-electricity-stats)