Britain's Electricity Generation - June 2026
Fuel Type Breakdown
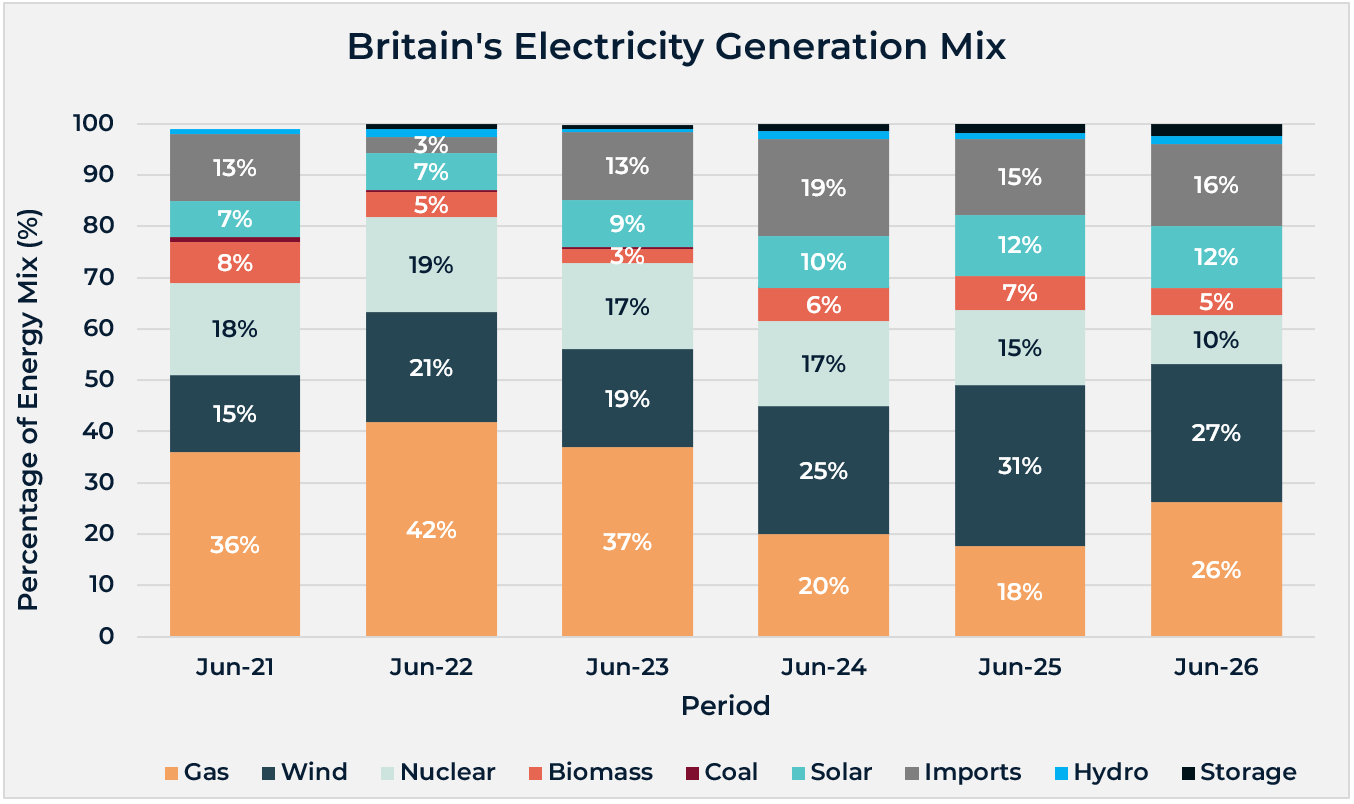
Britain’s electricity generation in June 2026 was led by wind, which contributed 27% of the energy mix. While slightly below the 31% recorded in June 2025, wind remained Britain’s largest individual source of electricity and continued to play a central role in the country's low-carbon power system.
Gas supplied 26% of electricity in June 2026, up from 18% in June 2025. This increase reflects more variable renewable generation during the month and resulted in gas narrowly trailing wind as one of Britain's largest generation sources.
Electricity imports accounted for 16% of the generation mix, broadly consistent with the 15% recorded in June 2025. This sustained contribution highlights the continuing importance of interconnectors in supporting system flexibility and security of supply.
Nuclear power contributed 10%, down from 15% in June 2025 and marking one of the lowest June shares in recent years. Reduced nuclear availability continues to place greater emphasis on renewable generation and imports to meet demand.
Solar output contributed 12%, unchanged from June 2025 and maintaining its strong seasonal performance during the summer months.
Biomass generation supplied 5% of electricity, down from 7% in June 2025, while continuing to provide a stable source of dispatchable low‑carbon generation.
Storage technologies contributed 2%, unchanged from June 2025 and maintaining their highest June share on record. This reflects the growing role of battery storage in balancing Britain's increasingly renewable-led electricity system.
Hydropower increased slightly to 2%, up from 1% in June 2025, while remaining a relatively small component of overall generation.
Coal once again remained absent from the generation mix, reinforcing Britain's continued transition away from coal-fired electricity generation following its phase-out in 2024.
Zero-Carbon Sources & Carbon Intensity
Zero-carbon sources, including wind, solar, nuclear, and hydro, generated 62% of Britain's electricity in June 2026. While slightly higher than the 61% recorded in June 2025, this continued the trend of maintaining a majority low-carbon electricity mix throughout the year.
Carbon intensity increased to 132 gCO₂/kWh in June 2026, compared to 98 gCO₂/kWh in June 2025. This rise reflects higher gas generation alongside lower contributions from wind and nuclear generation during the month. Despite the year-on-year increase, carbon intensity remains substantially below levels recorded earlier in the decade.
On a rolling 12-month basis, carbon intensity fell to 126 gCO₂/kWh, down from 129 gCO₂/kWh in the previous period. Meanwhile, the rolling 12-month average for zero-carbon generation increased to 64%, reaching its highest level on record and highlighting continued long-term progress in decarbonising Britain's electricity system.
Peak zero-carbon generation reached 92% during June 2026, matching the highest June level on record. On a rolling 12-month basis, average peak zero-carbon share increased to 91%, demonstrating the growing ability of the electricity system to operate at very high levels of decarbonisation during favourable conditions.
Concluding Remarks
June 2026 demonstrated both the progress and challenges associated with Britain's energy transition. While zero-carbon generation remained above 60% and the rolling 12-month average reached a record 64%, the month also highlighted the continued need for gas-fired generation when renewable output is lower and nuclear availability remains constrained.
Despite the increase in monthly carbon intensity compared to June 2025, long-term trends remain positive. Rolling carbon intensity continued to decline, while record levels of zero-carbon generation and peak zero-carbon operation underscore the growing maturity of Britain's low-carbon electricity system.
Looking ahead, maintaining growth in renewable capacity, alongside further investment in storage, grid flexibility, and firm low-carbon generation, will be essential to reducing reliance on gas during periods of weaker renewable output and sustaining progress towards a more resilient, decarbonised power system.
Britain's Electricity Summary Charts
Monthly Statistics
12-Month Rolling (Average) Statistics
To explore more insights, visit our interactive renewables map
here.
Data source: NESO 2026
(https://www.neso.energy/energy-101/great-britains-monthly-energy-stats)
About the Author
Doug is a Sustainability Consultant, specialising in carbon reporting and research, with extensive experience in supply chain emissions, regulatory compliance, renewable energy developments and sustainability performance improvement. He holds a Master’s degree in Green Economy, which underpins his ability to interpret complex environmental data and advise on practical, impactful strategies.
At edenseven, Doug leads the production of the firm’s monthly Britain’s Electricity Generation report, delivering clear, data-driven insights into the UK’s changing energy landscape. His work supports clients in understanding market trends, emissions performance, and opportunities for cleaner energy adoption.
Doug is a Registered Environmental Practitioner (REnvP) and an ISEP Practitioner, reflecting his professional standing and commitment to advancing sustainable practices across sectors.