Britain's Electricity Generation - April 2025
Fuel Type Breakdown
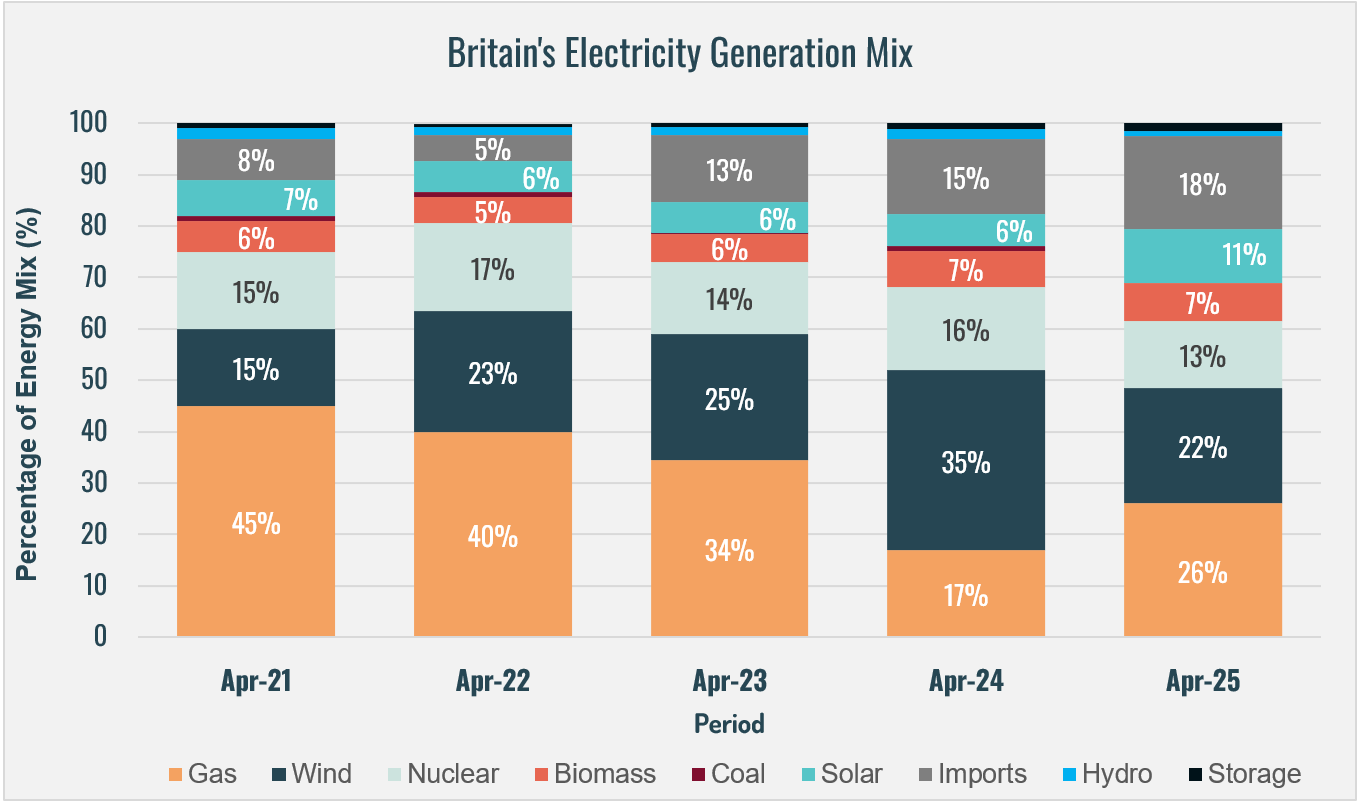
Britain’s electricity generation in April 2025 saw a notable shift, with gas reclaiming its position as the leading source of electricity generation. Contributing 26% of the energy mix, gas usage rose by nearly 10 percentage points compared to April 2024. Despite this, gas consumption remained below levels seen in April 2021, 2022, and 2023.
The rise in gas was largely a response to a substantial drop in wind energy generation, which fell by more than 10 percentage points year-on-year to 22%. This was wind’s second-lowest April contribution in the last five years. The shortfall in wind output played a critical role in driving up reliance on fossil fuels, undermining progress toward a cleaner energy mix.
Likely as a result of favourable weather conditions, solar generation rose sharply, from 6% in April 2024 to 11% in April 2025. This marks its highest April contribution in five years and highlights solar’s growing potential in Britain’s energy transition.
Conversely, nuclear power continued to decline, contributing just 14% to the electricity mix, down from 16% the previous year and its lowest April share in half a decade. The consistent drop in nuclear output, coupled with weak wind performance, placed additional pressure on other sources to fill the gap.
Biomass remained stable at 7%, matching its highest April contribution in the last five years, while hydropower fell slightly to 1%. Together, these sources provided limited compensation for the downturn in wind and nuclear output.
Coal contributed 0%, following its complete phase-out in September 2024. For context, coal had still accounted for 1% of electricity generation in April 2024.
Electricity imports increased by 3 percentage points to 18%, the highest April share in five years, suggesting growing reliance on cross-border supply to maintain grid stability. Similarly, storage technologies contributed 2% to the mix, their highest April level to date, signaling incremental progress in energy flexibility and resilience.
Zero-Carbon Sources & Carbon Intensity
Zero-carbon sources, comprising wind, solar, nuclear, hydro accounted for 46% of electricity generation in April 2025. This represented a 13% decline from April 2024, and was accompanied by a sharp rise in carbon intensity to 133 gCO₂/kWh, a 45% year-on-year increase.
Over a longer timeframe, the 12-month rolling average for zero-carbon generation stood at 49%, down 2% from the previous year. Meanwhile, the 12-month rolling average carbon intensity stood at 131 gCO₂/kWh, only 8% lower than the year before and a sharp contrast to the 22% year-on-year reduction recorded just six months earlier in October 2024. This underscores a concerning stagnation in Britain’s clean energy momentum.
Concluding Remarks
April's mixed performance highlights a concerning slowdown in Britain's progress towards a decarbonised energy grid. The decline in the share of renewables over the last 12-months, coupled with only an 8% year-on-year reduction in carbon intensity, highlights a loss of momentum in decarbonising the grid.
While the increased supply from solar and storage is a positive development, the decline in wind, nuclear and hyrdo is concerning. Although wind's decline may reflect temporary weather conditions, the broader trend signals an urgent need to ramp up investment into renewables. To restore progress toward a resilient, net zero power system and reduce dependence on imports, Britain must accelerate the deployment of renewables and strengthen its commitment to long-term energy security.
Britain's Electricity Summary Charts
Monthly Statistics
12-Month Rolling (Average) Statistics
To explore more insights, visit our interactive renewables map
here.
Data source: National Grid ESO 2025
(https://www.nationalgrideso.com/electricity-explained/electricity-and-me/great-britains-monthly-electricity-stats)